How To Monitor Your Online Reputation: Step-By-Step & Tools
Monitoring your online reputation will provide the insights you need into what is prospects, customers, and other stakeholders are saying about you. You’ll improve your understanding of customers, and that will shed light on to what degree your products or services perform in search results and commercially. To top it off, you’ll have a better chance to avoid a crisis or controversy by catching it in its early stages before it has a chance to get out of control.
Online reputation management tools automate many of your efforts and can reveal valuable insights that you may’ve otherwise missed. Below we outline the reputation tools we’re asked about the most. The tools below are used to not only monitor your online reputation but to do other things as well. At Reputation X we use diverse tools to monitor our clients’ online profiles because no single tool provides a complete solution on its own.
Note: If you are looking for SEO tools we use, you can find them here.
Table of Contents
- Identify Relevant Online Channels and Keywords
- Establish a Baseline and Set Up Alerts
- Engage with Customers and Respond to Feedback
- Analyze and Report on Online Reputation Data
- Improve Your Online Reputation Management Strategy
- Tools To Use
- Maximize Your ORM Efforts
- FAQs
1. Identify Relevant Online Channels and Keywords
Effective online reputation management requires a comprehensive approach that goes beyond simply searching for your company name on Google every few months. To stay on top of how your brand is perceived, it’s crucial to monitor various online channels where consumers engage with your business.
Importance of Monitoring Various Online Channels
Today’s digital landscape spans multiple platforms, each offering unique insights into different aspects of your brand:
- Social Media: Channels like Facebook, Twitter, and Instagram can reveal real-time customer sentiments and opinions about your brand.
- Review Sites: Platforms such as Yelp and Google Reviews provide in-depth feedback on customer experiences with your products or services.
- Specialized Forums: Industry-specific forums can offer detailed discussions relevant to your niche, shedding light on customer preferences and concerns.
Selecting Relevant Keywords and Phrases
To gather comprehensive insights about how your brand is discussed online, choose keywords that are most relevant to your business:
- Include your brand names, product names, and industry-specific terms that could influence customer perception.
- Tracking these keywords helps in identifying trends, analyzing sentiments, and understanding the context of conversations around your brand.
Utilizing Tools and Platforms
Leverage the numerous tools available to assist with effective online reputation monitoring:
- Software like Google Alerts, Mention, Hootsuite, and Brandwatch can help track mentions, analyze sentiments, and compile data across different channels.
- These tools automate much of the process, providing real-time alerts and detailed analytics to help you stay informed and responsive.
By adopting this multifaceted approach, you can capture the full spectrum of customer interactions and opinions about your brand, enabling you to respond proactively and maintain a positive reputation.
2. Establish a Baseline and Set Up Alerts
To gauge the effectiveness of your online reputation management efforts, it’s essential to establish a benchmark against which you can measure progress.
Measuring Your Current Online Reputation
- Begin by analyzing existing mentions, reviews, and feedback about your brand to understand its current online reputation.
- Tools such as social media listening platforms, review sites, and Google My Business can be invaluable sources of this information.
Setting Up Alerts
- Use tools to set up alerts for specific keywords and phrases relevant to your brand.
- Google Alerts can send real-time notifications whenever your brand or related keywords are mentioned online.
- BuzzSumo offers keyword tracking, brand mention alerts, and more.
- Platforms like Hootsuite and Mention provide comprehensive solutions for real-time brand monitoring.
Regularly Reviewing and Analyzing Alerts
- Consistent review and analysis are key to effective monitoring, helping identify patterns and trends.
- Monthly or bi-weekly reviews are recommended to stay on top of new developments and modify strategies based on collected data.
By establishing a baseline and setting up alerts, you can quickly identify both positive trends to capitalize on and negative ones to address before they escalate. This proactive approach enables you to stay informed, responsive, and ensures your online reputation remains intact, enhancing the overall effectiveness of your reputation management strategies.
3. Engage with Customers and Respond to Feedback
Engagement is the cornerstone of effective online reputation management, demonstrating that you value customer input and are committed to addressing their concerns.
Actively Engaging with Customers
- Be proactive in responding to feedback, whether positive or negative.
- Acknowledge positive reviews and provide well-thought-out responses to negative comments to maintain customer satisfaction.
- 83% of customers appreciate how much the company treats them just as much as they do the product that they are selling.
- Microsoft’s Xbox Support team on Twitter exemplifies quick and helpful responses, leading to increased customer loyalty.
Using a Consistent Tone of Voice
- Maintain a consistent tone and messaging across all online channels to build a coherent brand image.
- Whether using a casual tone on social media or a more formal approach on professional forums, consistency is key.
- Apple’s user-friendly communication approach is a prime example of how consistency solidifies a strong brand identity.
Implementing a Clear Escalation Process
- Establish a clear escalation process for handling customer complaints and issues.
- Ensure that more complex issues are addressed by the right departments quickly and efficiently.
- Amazon’s customer service team is recognized for its effective issue resolution, contributing to their positive online reputation.
By engaging with your audience and responding to their feedback, you not only improve your online reputation but also foster stronger customer relationships and trust. Proactive engagement and consistent communication help build a loyal customer base, ensuring long-term business success.
4. Analyze and Report on Online Reputation Data
Understanding and interpreting the data collected from your online reputation monitoring efforts is crucial for making informed decisions and strategic adjustments.
Using Data Analytics Tools
- Leverage robust analytics tools such as Google Analytics, Sprout Social, and Sentiment Analysis Dashboard to manage the vast amount of data.
- These tools break down complex datasets into actionable insights, helping you grasp the nuances of your online reputation.
- Google Analytics provides in-depth traffic and user behavior analysis, Sprout Social offers comprehensive social media analytics, and Sentiment Analysis Dashboards reveal public sentiment trends.
Creating Regular Reports
- Establish a routine of compiling regular reports to track progress over time.
- Employ software like Tableau and Microsoft Power BI to create easy-to-understand, comprehensive reports.
- Focus on key metrics, reveal trends, and pinpoint areas needing improvement.
- Both Tableau and Power BI excel at turning raw data into visually compelling stories that are easy for stakeholders to understand and act upon.
Sharing Insights with Stakeholders
- Ensure that key stakeholders receive regular updates to foster an environment of informed decision-making and strategic planning.
- Sharing detailed reports promotes a collaborative approach, encouraging collective efforts to address potential issues and enhance online reputation.
- This rapport is crucial for driving data-driven strategies that keep your organization ahead of potential reputation risks.
Through thorough analysis and consistent reporting, your business can proactively manage and continually improve its online reputation, adapting quickly to emerging trends and mitigating potential risks.
5. Improve Your Online Reputation Management Strategy
An effective online reputation management strategy must be dynamic, requiring continuous improvement and adaptation to stay relevant and effective in the ever-evolving digital landscape.
Regularly Reviewing and Updating Your Strategy
- Periodically analyze the performance of your current tactics and refine them based on the latest ORM best practices.
- This ensures your strategy remains effective against new challenges and opportunities.
Leveraging New Tools and Technologies
- Stay informed about new tools and technologies that can enhance your monitoring and engagement capabilities.
- AI-driven analytics tools can provide deeper insights into customer sentiment and detect potential reputation threats early.
- Staying active on emerging social media platforms can help you reach a broader audience and stay ahead of trends.
Learning from Customer Feedback and Industry Trends
- Regularly analyze reviews and survey results to identify areas for improvement in your offerings and customer service protocols.
- Keep an eye on industry trends to adjust your marketing strategies, aligning with current preferences and expectations.
- This helps build stronger customer trust and loyalty.
Continuous improvement ensures that your online reputation management efforts remain effective and relevant, helping you maintain a strong, positive brand image over the long term
Tools To Use
The following are some useful tools you can use to closely monitor your business’s online reputation.
SEM Rush
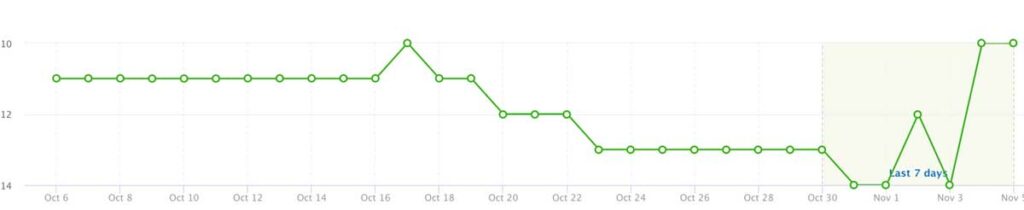
SEMRush is a professional search engine optimization tool that is used for many SEO (search engine optimization) related tasks. One of its abilities is to track where branded search results rank in Google. It also has a “brand monitoring” function, and many others. When it is used with other aspects of the tool you can receive notifications about your brand (called monitoring) and also monitor the relative positions of certain search results to understand how visible they are.
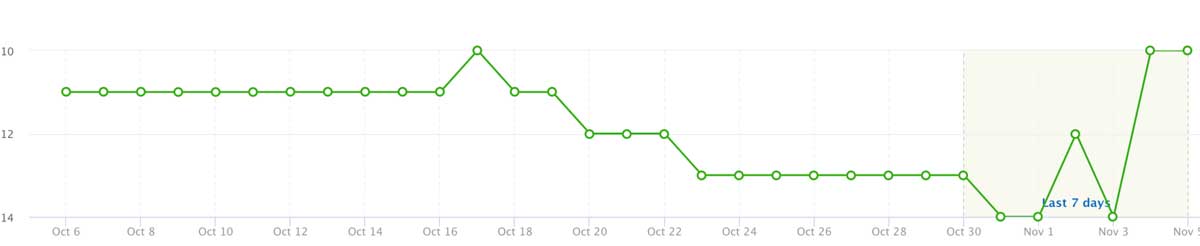
For example, let’s say your company has a Yelp problem. You can setup SEMRush to track the Google position of Yelp to get an idea over time as to how visible it is. If you have bad Yelp reviews you want Yelp to be on page 99 of search results (it’s usually on the first two pages though). By tracking both mentions and the position of negative search results you can get an idea as to whether you should be optimizing other review sites above any negative review issues you have. Of course, you should be working to improve those reviews too.
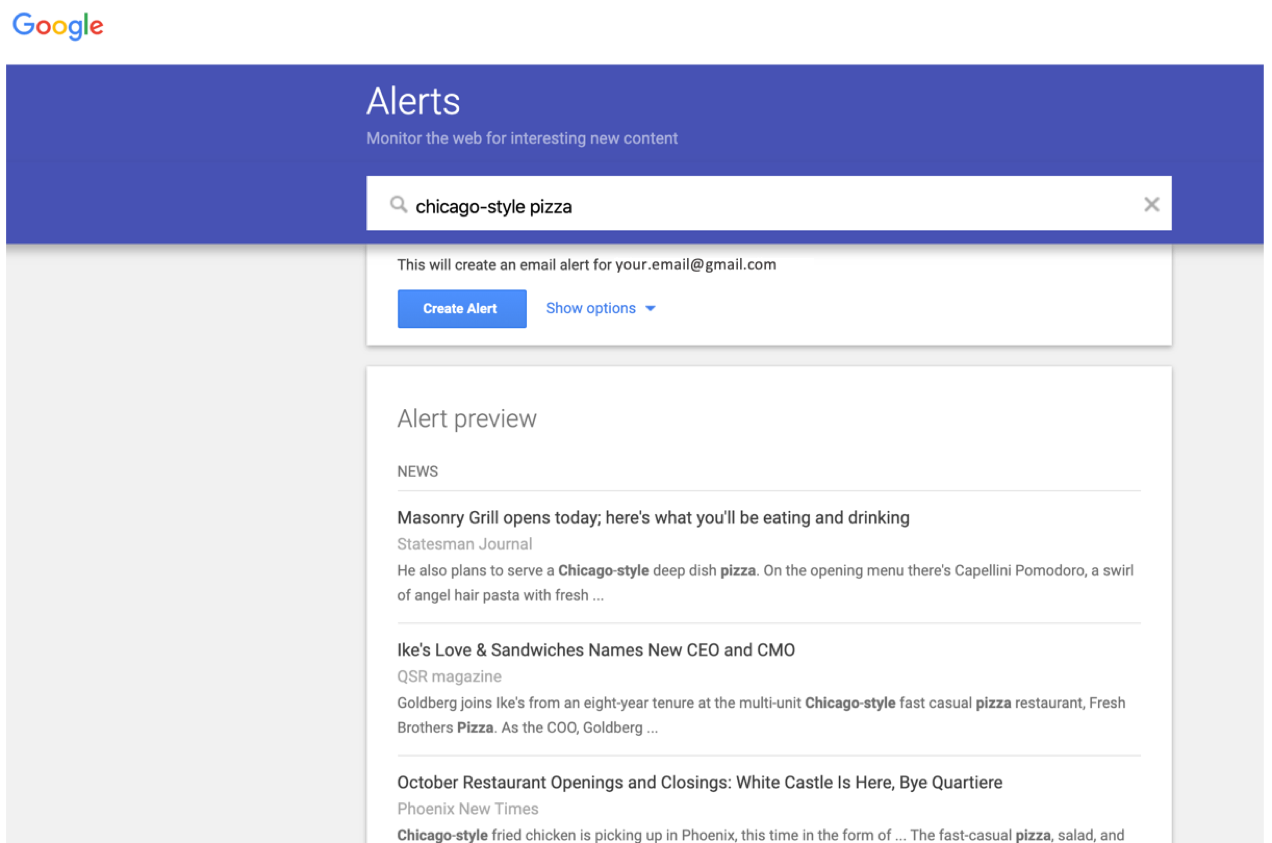
Google Alerts
Good old Google Alerts. We’ve found Google alerts to be best at being free, but there are better tools out there.
Google Alerts is a free web monitoring service offered by the search engine behemoth itself. You can set up alerts for your company name and industry keywords. This is a multi-purpose tool, since you can use it to monitor your brand mentions, which includes negative mentions, and you can also get content creation ideas from your industry keywords.
It’s super easy to set up Google Alerts. All you have to do is type in the keyword you’d like to receive notifications for and select a few options regarding frequency and region. Then you’ll receive emails that keep you up-to-date on the search results for your keyword or brand.
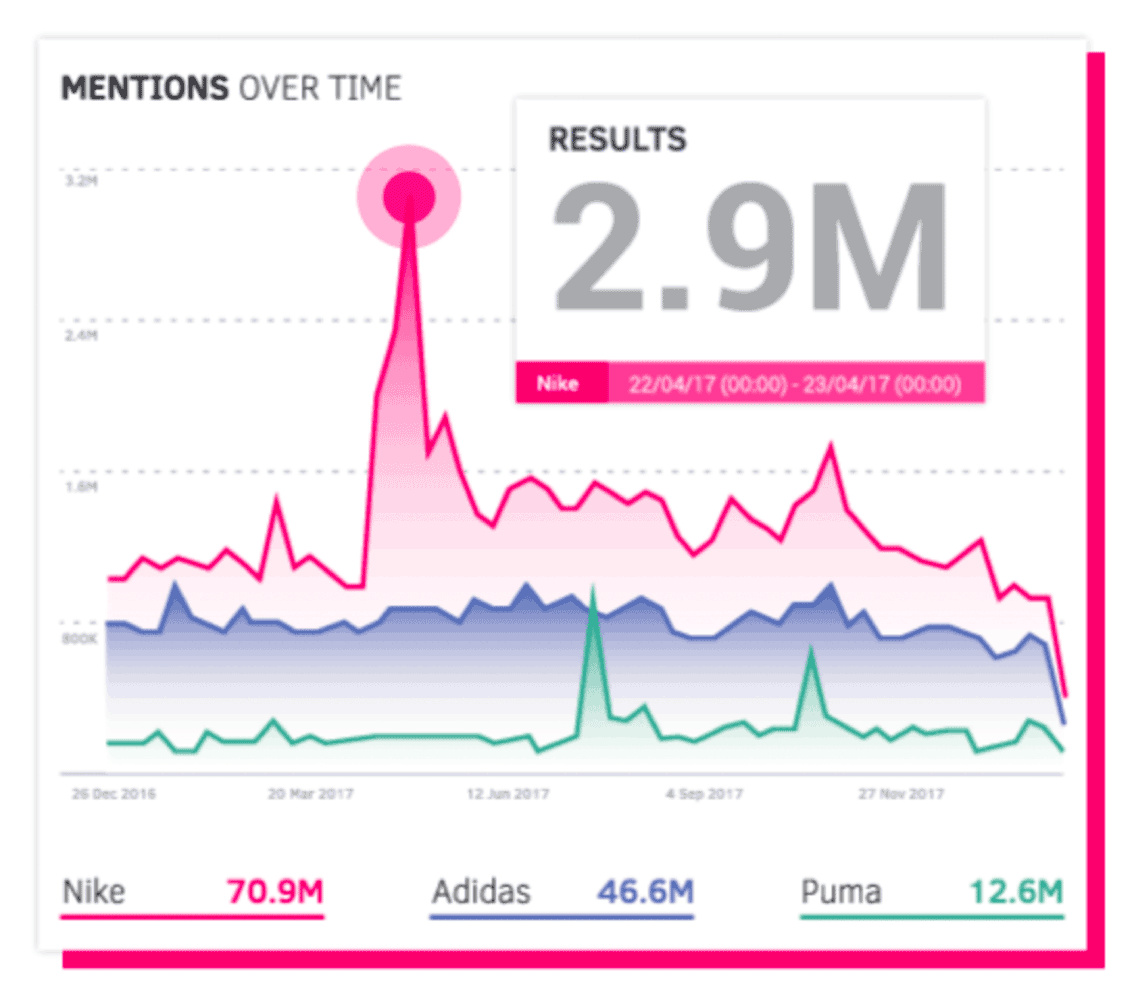
Mention
Mention works similarly to Google Alerts in the social media sphere, but is more robust. Mention will monitor social media to find any mentions of you or your brand in online conversations. You can listen to online conversations, publish relevant content, and interact with your audience directly. The platform allows you to monitor over 1 billion sources daily to catch any mentions of your name — both good and bad.
Mention performs both monitoring and listening as well as competitive analysis. Competitive analysis is when you monitor the conversation around your competition to understand industry trends as well as sentiment.
Review Push
Review Push is mainly about review monitoring. It simplifies review management by collecting all of your reviews in one place. This tool is particularly useful for business owners with multiple locations, as the software offers multi-site monitoring and unlimited locations. You can monitor reviews made on social media and top review sites.
Multi-level reporting allows you to drill down into reviews to see how different stores rank against each other. You can even find out which review sites that your brand doesn’t appear on, enabling you to target those platforms to improve your overall review strategy. Set up email alerts to alert you of any new reviews, giving you the opportunity to quickly respond to both positive and negative reviews.
Talkwalker
Talkwalker is a free monitoring tool that enables you to track your campaigns and hashtags. There is no limit to the number of searches you can perform, and the service is available in 187 languages. You can search for your own campaigns and hashtags or those of your competitors to gain valuable intel that will place you ahead of your competition.
ReviewTrackers
ReviewTrackers is a great tool for business owners to monitor online reviews. You can set up email alerts for notifications that drill down into information on the overall sentiment of your reviews and the aspects of your business that get mentioned most often. There is also a mobile app that can be used to track and respond to reviews any time, even when you don’t have your laptop handy.
Birdeye
Birdeye is a good review monitoring and improvement tool for many companies. Its main reason to exist is to improve reviews and ratings but it does have a Birdeye Alerts function. Our main issue with Birdeye is that it doesn’t provide “gating”. Gating is when two-steps are used to get customers to write reviews:
- Step 1: Ask for a thumbs up or down from the customer.
- Step 2: If they gave it a thumbs up – send them to a review site. If a thumbs down – customer service steps in and no review is requested.
Birdeye doesn’t do gating, instead all customers are sent to a review site no matter their opinion. This may work for many companies (Birdeye says it does, our experience is a bit different), and is how Yelp and other review sites prefer things. But many industries (debt collectors, travel companies that rely on third-party service experiences, etc.) don’t respond as well to non-gated systems as they do gated ones.
Birdeye has a beautiful user interface (UI) though. Our favorite UI in fact. And its monitoring functionality is very good.
Maximize your ORM efforts
This is by no means a comprehensive list of all of the online reputation management monitoring tools out there. We’ve simply provided an overview of a few of the tools people ask us about most. Any one of these tools will help to automate your online reputation management, freeing up your time to work on improving or maintaining your reputation. We use many of them.
Once you start gathering the insights these tools make available, it’s important to create action. Knowing what is being said about you online will help to develop a personalized reputation management strategy. You’ll know which areas of your business are thriving, which ones need improvement, and you’ll be more connected to your audience or customers.
If you need a little extra help managing your online reputation or are looking for more creative ways to act on your data, feel free to contact us today.
FAQs
How do I monitor my online reputation?
Online reputation management tools can save time and reveal valuable insights into your reputation management efforts. There are plenty of free and paid monitoring tools available to help.
What are the benefits of monitoring my online reputation?
Monitoring your online reputation provides the insights you need to improve your understanding of customers. That information can be used to improve your products or services, and improve your search results.
What tools can I use to monitor my online reputation?
The most popular reputation monitoring tools are: SEMRush, Google Alerts, Mention, Review Push, TalkWalker, ReviewTrackers, and Birdeye.
About the author
Brianne Schaer is a Writer and Editor for Reputation X, an award-winning online reputation management services agency based in California. Brianne has more than seven years of experience creating powerful stories, how-to documentation, SEO articles, and Wikipedia content for brands and individuals. When she’s not battling AI content bots, she is cruising around town in her Karmann Ghia. You can see more of her articles here and here.
–
Tags: Review Management.